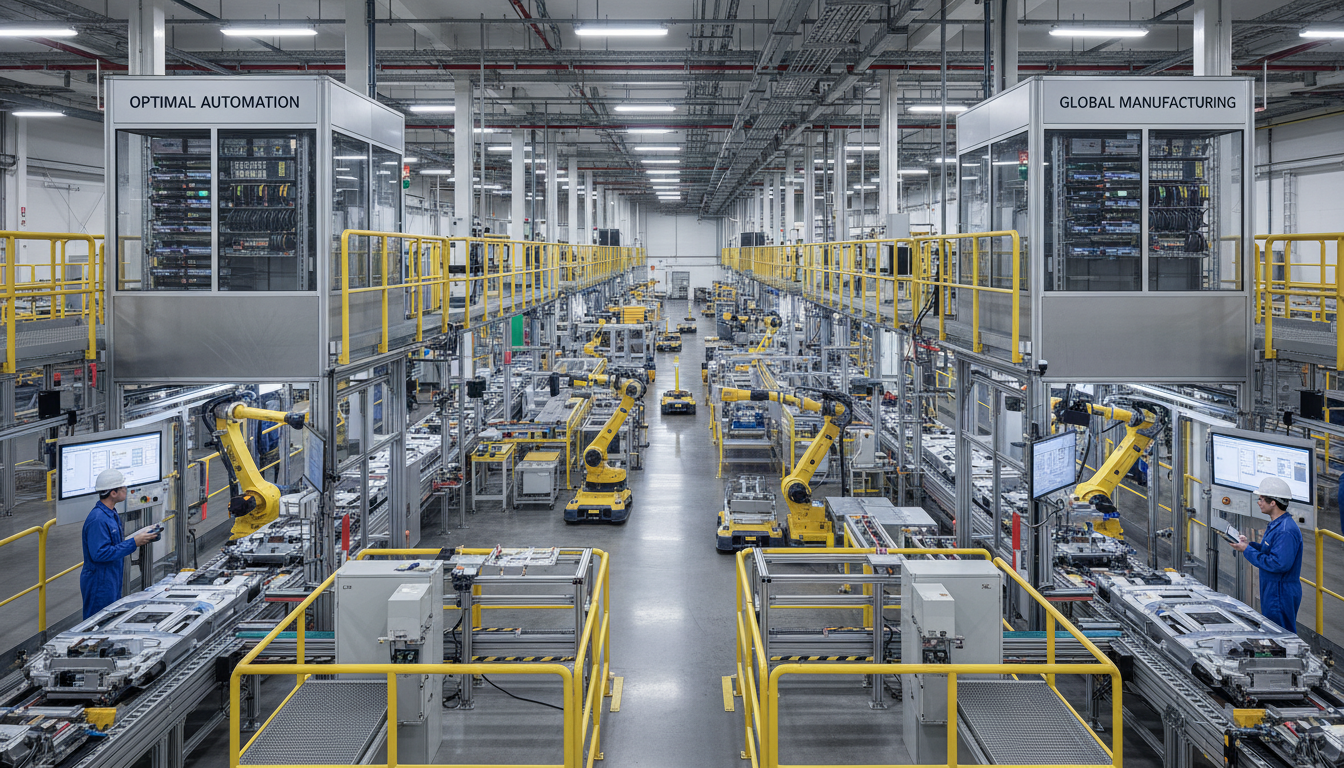
What is OEE in manufacturing refers to Overall Equipment Effectiveness, a standard metric that measures the percentage of planned production time that is truly productive. It is calculated by multiplying equipment availability, performance efficiency, and quality output to provide a clear view of operational efficiency. This KPI helps manufacturers identify hidden losses and optimize production processes using existing machine data.
Most plant managers recognize the frustration of seeing production targets slip without a clear understanding of where the leakage occurs. You might have a gut feeling that downtime or micro-stops are eroding your margins, yet without precise data, your strategy remains reactive. Overall Equipment Effectiveness, or OEE, serves as the primary diagnostic tool for identifying these hidden inefficiencies. It is not merely a percentage to report during quarterly reviews; it is a framework for operational discipline. In this guide, we will break down the fundamental OEE formula across availability, performance, and quality. We will also examine why manual tracking fails in a digital environment and demonstrate how to leverage your existing PLC tags to automate data collection. By mastering the six big losses and targeting world class benchmarks, you can transform OEE from a passive metric into an active driver of bottom line growth.
Defining Overall Equipment Effectiveness: More Than Just a Metric
Overall Equipment Effectiveness, commonly known as OEE, serves as the ultimate benchmark for production efficiency. To answer the fundamental question of what is OEE in manufacturing, it is a percentage-based metric that accounts for Availability, Performance, and Quality to determine how much of a plant's planned production time is actually productive. Within the framework of lean manufacturing, OEE identifies where a process is losing time or resources; it acts as a diagnostic tool for systematic continuous improvement.
Many firms treat OEE as a retrospective checklist or a manual tally for a weekly reporting cycle. At Lebron Industrial Operations & AI, we view it as a live data stream integrated directly into your industrial operations and AI infrastructure. Rather than relying on human memory or manual logs, we utilize PLC to Cloud integration to capture machine states in real time. This shift moves OEE from a historical report to an active operational tool.
For manufacturers operating throughout the New Jersey industrial corridor, from Parsippany-Troy Hills to the logistics hubs, OEE is the gold standard for uncovering hidden capacity. By analyzing existing machine data, plant managers can often increase throughput significantly without the need for major capital expenditure on new equipment. It transforms the shop floor from an opaque environment into a transparent, data-driven operation.
The OEE Calculation Formula: Breaking Down Availability, Performance, and Quality

To move beyond a conceptual understanding of what is OEE in manufacturing, one must master the three pillars that comprise the metric: Availability, Performance, and Quality. This framework is essential when designing industrial operations and AI infrastructure, as it defines the precise data points that must be extracted from the shop floor. The calculation is a product of these three factors, where each represents a specific category of operational loss. Because the factors are multiplied, a small drop in one can significantly impact the final score, providing a clear picture of how cumulative inefficiencies erode profitability.
Availability measures the time a machine is actually running versus the time it was scheduled to run. It is calculated by dividing Actual Run Time by Planned Production Time. Performance evaluates how close the process is to its maximum speed, calculated as the ratio of actual throughput to the maximum theoretical speed. Finally, Quality is the ratio of good parts to total parts produced, excluding any units that require rework or disposal.
OEE Factor | Operational Focus | Calculation Formula |
|---|---|---|
Availability | Downtime & Setups | Actual Run Time / Planned Production Time |
Performance | Speed & Minor Stops | (Ideal Cycle Time × Total Count) / Run Time |
Quality | Scrap & Rework | Good Units / Total Units |
Consider a high-speed packaging line in Parsippany-Troy Hills running a standard eight-hour shift (480 minutes). If the line has 30 minutes of planned breaks and 30 minutes of unplanned downtime for a jammed conveyor, the Actual Run Time is 420 minutes out of a Planned Production Time of 450 minutes, resulting in 93.3% Availability. If that same line is rated to pack 60 units per minute but only averages 50 units per minute during its run time, the Performance sits at 83.3%. If 21,000 units are produced but 400 are rejected by a vision system, the Quality is 98.1%.
Multiplying these components (0.933 x 0.833 x 0.981) yields an OEE of 76.2%. This data, when captured through PLC to Cloud integration, allows managers to see exactly where the 23.8% loss occurred without waiting for end-of-shift reports. It identifies whether the bottleneck is a mechanical failure, a slow-running motor, or a raw material quality issue.
The Automation Gap: Why Manual OEE Tracking Fails Modern Plants
The "clipboard OEE" method relies on operators manually recording events, which often happens at the end of a shift when memories have faded. This approach introduces systemic bias; an operator is unlikely to log a thirty-second micro-stop, yet hundreds of these events can occur daily. When downtime is recorded, it is frequently subject to "rounding," where a precise eight-minute mechanical failure is logged as five or ten minutes. These inaccuracies ripple through the entire calculation, rendering the final OEE percentage a poor reflection of reality.
For a manufacturing facility to achieve a true "source of truth," the data must come directly from the source. Our approach at Lebron Industrial involves PLC to Cloud integration to bypass manual entry entirely. By extracting real-time state changes from the machine controller, we provide a granular view of production that human observation cannot match. This automated architecture is a foundational component of modern industrial operations and AI infrastructure, ensuring that plant managers are making decisions based on hard machine facts rather than subjective interpretations. Moving from manual logs to automated data streams is the only way to identify the "hidden factory" lost to minor stops and speed losses. This transition requires more than just software; it necessitates the technical procurement services to identify and install the right hardware bridges between legacy controllers and modern analytics platforms.
How to Extract OEE Metrics from Your Existing PLC Tags

Bridging the automation gap begins with a targeted audit of the tag database residing within your Programmable Logic Controller (PLC). Most industrial equipment in North Jersey factories, even legacy assets commissioned decades ago, already monitors the precise variables needed to define what is OEE in manufacturing. The technical challenge is rarely a lack of raw data; it is the absence of a structured pipeline to move that data from a local register to an enterprise dashboard.
To calculate Availability, engineers must identify the specific bit that indicates the machine is in a value adding state. In many environments, this is found in tags like `Machine_Auto_Running`, `Cycle_Active`, or `Process_In_Step`. By monitoring the transition and duration of these bits, we capture the micro-stops that manual logging inevitably misses. If these bits are low during scheduled production hours, the system automatically logs downtime without requiring operator intervention.
Performance tracking relies on throughput counters. We look for high speed counter tags, stroke counts, or pulse signals such as `Part_Produced_Pulse`. By comparing the frequency of these pulses against the Ideal Cycle Time, which we often store in the cloud layer of the industrial operations and AI infrastructure, we can calculate real time speed loss. This allows managers to see if a machine is technically running but underperforming due to mechanical wear or suboptimal settings.
Quality metrics are extracted by mapping tags associated with downstream inspection points. This includes `Reject_Gate_Trigger`, `Vision_System_Fail`, or `Weight_Scale_Out_of_Bounds` bits. When a sensor detects a defect and triggers an ejection solenoid, that specific event is captured to provide an automated count of scrap versus good parts.
OEE Pillar | Typical PLC Tag References | Data Type |
|---|---|---|
Availability | `Auto_Mode_Status`, `Safety_Circuit_Closed`, `Run_Relay` | Boolean (Bit) |
Performance | `Cycle_Counter`, `Encoder_Value`, `Bottles_Per_Minute` | Integer / Real |
Quality | `Reject_Solenoid`, `QC_Pass_Bit`, `Vision_Result_Word` | Boolean / Integer |
Mapping these existing tags is the most cost effective way to modernize a facility. Through technical procurement services, we select the appropriate edge gateways to facilitate PLC to Cloud integration. This bridge turns dormant register data into a live stream of operational intelligence, providing the transparency needed to move from reactive maintenance to proactive optimization.
Understanding the Six Big Losses in Manufacturing

To answer the common industry question regarding what are the six big losses in OEE, these categories represent the specific ways manufacturing efficiency is eroded. By mapping PLC tags to these losses, plant managers can move beyond a single percentage and identify the root cause of lost capacity. Within the framework of industrial operations and AI infrastructure, we categorize these losses into three buckets derived directly from machine data.
Availability Losses: These include Unplanned Breakdowns, such as a motor failure captured by a fault bit, and Planned Downtime, which covers scheduled changeovers. Automated systems track how long a machine remains in a `Setup_Mode` state to ensure changeover targets are met.
Performance Losses: This category captures Minor Stops, those brief pauses often ignored in manual logs, and Reduced Speed. PLC to Cloud integration identifies these by detecting when the `Cycle_Active` bit remains low for short intervals between counts or when the actual RPM falls below the nameplate capacity.
Quality Losses: These consist of Production Rejects during steady operation and Startup Rejects during machine warm-up.
PLC data serves as the objective judge for these losses. For example, startup scrap is identified by correlating `Reject_Gate` triggers with the `Machine_Start_Sequence` bit. In a high volume North Jersey facility, this distinction is critical; it tells maintenance whether they need to fix a broken component or if the engineering team needs to optimize warm-up logic. Using technical procurement services to deploy high resolution sensors ensures these losses are categorized automatically, providing the data necessary to justify hardware upgrades based on quantifiable ROI.
What is a World Class OEE Benchmark?
While the theoretical goal is 100 percent, representing zero downtime and perfect quality, this is rarely achieved in complex environments. For discrete manufacturing, an 85 percent score is widely recognized as World Class. However, many North Jersey facilities beginning their digital transformation journey find their initial automated readings fall between 40 percent and 60 percent. This delta is not a sign of failure but a roadmap for industrial operations and AI infrastructure improvements.
Rather than obsessing over reaching a generic 85 percent benchmark overnight, plant managers should prioritize the delta between yesterday and today. A static number provides a snapshot; a trend provides a strategy. By utilizing PLC to Cloud integration, teams can observe how specific interventions, like a new preventive maintenance schedule or refined technical procurement services for spare parts, directly move the needle.
Understanding what is OEE in manufacturing requires viewing it as a dynamic baseline. If a packaging line in Parsippany improves from 55 percent to 62 percent over a quarter through data-driven adjustments, that represents a massive gain in hidden capacity. Real-time data turns OEE from a vanity metric into a high-fidelity feedback loop for continuous improvement cycles.
Maximizing your operational efficiency does not always require a massive overhaul of your hardware. By leveraging the PLC data you already collect, you can gain deep insights into your production performance and identify critical areas for improvement. While the path to operational excellence is rewarding, navigating the technical integration can be complex. If you want expert help building these automated systems, we invite you to explore our Services to see how we can assist your team.