
To learn how to reduce manufacturing scrap, organizations must leverage existing PLC data to monitor production variables and identify the root causes of defects in real time. By integrating these data points into automated quality checks, manufacturers can improve First Pass Yield, optimize production workflows, and minimize costly material waste.
Every defective part represents more than just wasted raw material; it represents lost machine time, unnecessary labor costs, and a direct hit to your facility’s bottom line. For many New Jersey industrial leaders, the true cost of scrap remains obscured by the hidden factory, where rework and minor defects are accepted as the price of doing business. The solution to these inefficiencies is likely already residing within your facility, trapped inside your existing PLC sensors and control logic. This guide outlines how to leverage that untapped data to improve first pass yield. We will explore how to extract actionable insights from your hardware, contextualize production metrics for precise root cause analysis, and transition from reactive Excel tracking to proactive, real time dashboards that detect process drift before it results in a bin full of waste.
The Hidden Factory: Why Your Scrap Rate is Higher Than You Think
Manufacturing scrap is typically defined as material that fails quality standards and cannot be recovered, while rework involves units that require additional labor to meet specifications. Most operational managers focus on the direct cost of these items, yet this narrow view ignores the Hidden Factory. The Hidden Factory represents the portion of your production capacity that exists solely to fix errors or process waste. It is a ghost operation that consumes electricity, floor space, and machine cycles without contributing to the bottom line.
While generic consulting often suggests better communication or manual audits to address these issues, these methods fail to capture the granular reality of the shop floor. For manufacturers in Parsippany-Troy Hills and throughout the Northeast, where labor rates and material overhead are among the highest in the country, the Hidden Factory is a critical margin killer. Every minute spent producing a defective part is a minute of lost throughput that can never be recovered.
At Lebron Industrial Operations & AI, we approach the problem through systems engineering expertise. We view scrap not merely as a loss to be minimized, but as a rich data signal. By building a robust Industrial IoT data architecture, we can transform these quality failures into actionable insights. Understanding how to reduce manufacturing scrap begins by recognizing that every rejected part is a high-resolution report on process instability that your current systems are likely ignoring.
Metrics That Matter: First Pass Yield vs Final Yield
To effectively monitor how to reduce manufacturing scrap, you must distinguish between what looks like success and what actually drives profit. Most facilities rely on Final Yield, which measures the total number of acceptable units completed at the end of a shift divided by the units started. While this satisfies accounting, it obscures the operational reality by ignoring the resources consumed during rework.
The superior metric is First Pass Yield (FPY). It measures the percentage of units that move through the entire process without being scrapped, returned for rework, or adjusted. The formula is:
(Total Units Entering Process - Scrap - Rework) / Total Units
Metric | Focus | What It Hides |
|---|---|---|
Final Yield | Throughput and Output | Labor and energy spent on rework |
First Pass Yield | Process Stability | Nothing; it exposes the Hidden Factory |
Consider a production run of 1,000 components. If 50 units are scrapped and 150 require rework to meet quality standards, the Final Yield is 95%. On paper, this looks efficient. However, the FPY is actually 80%. Those 150 reworked units represent a significant loss; they consumed double the machine cycles, extra labor hours, and additional utility costs. By focusing on Final Yield, management misses the 15% of capacity lost to correcting errors.
Accurate FPY tracking requires a sophisticated Industrial IoT data architecture that distinguishes between a standard cycle and a rework loop. Identifying these inefficiencies is the first step in applying systems engineering expertise to reclaim lost margins. If your data does not distinguish between a unit that passed the first time and one that was saved through manual intervention, your scrap reduction efforts will always be reactive rather than proactive.
Step 1: Unlocking Data Trapped in Your PLCs and Sensors
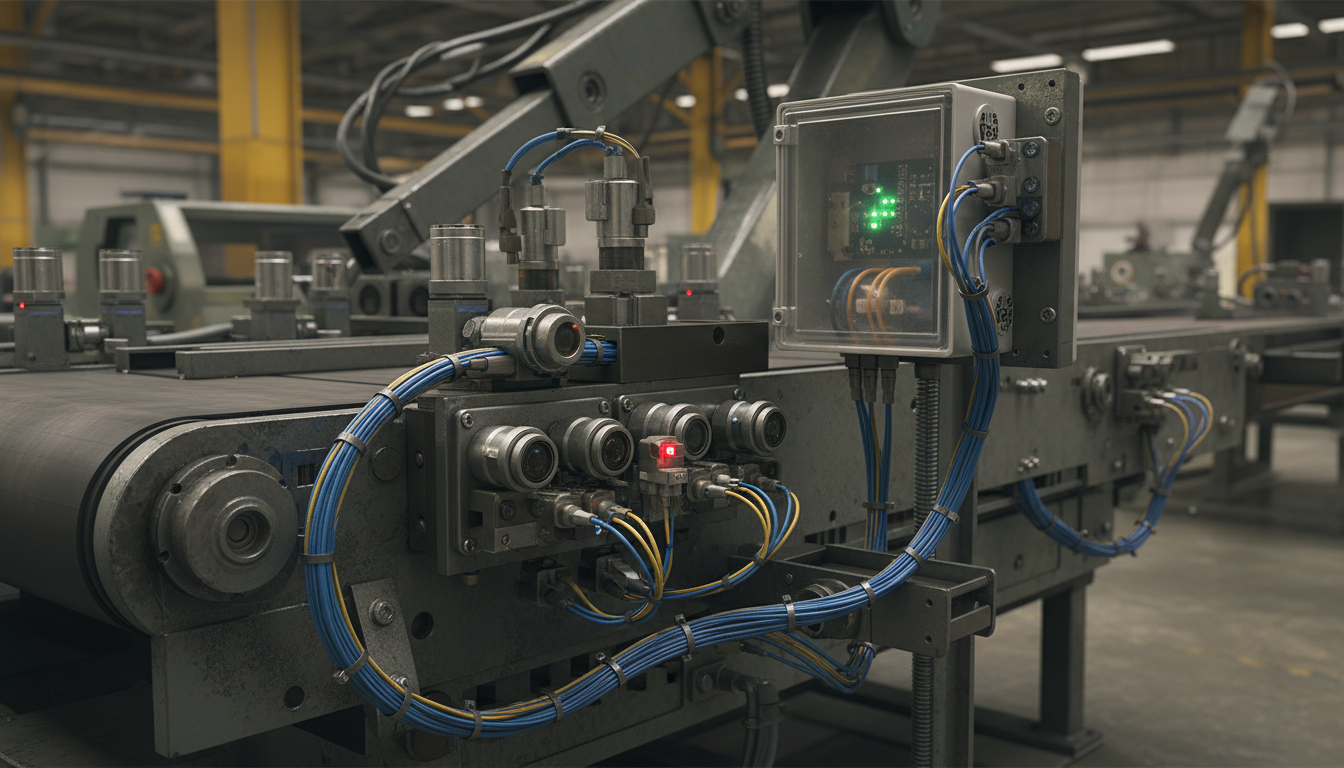
Most digital transformation guides start with a sales pitch for a corporate SaaS platform, but this puts the cart before the horse. The foundation for learning how to reduce manufacturing scrap lies within the controllers already running your lines. Modernizing your operations does not necessarily require a fleet of new sensors; it requires unlocking the telemetry already living inside your Programmable Logic Controllers (PLCs).
A standard PLC contains thousands of tags that act as real-time diagnostic tools for process health. To identify why a part failed, we look at specific machine signatures that occur seconds before a reject event. Critical tags include:
Cycle Time Deviations: Micro-stalls or slight increases in cycle duration often precede tool breakage or mechanical fatigue.
Torque Limits: A servo motor drawing excessive current to complete a press or rotation suggests material resistance or a part that is physically out of tolerance.
Thermal Fluctuations: In processes like extrusion or injection molding, tracking heat creep in the barrel against scrap events reveals how environmental variables affect material viscosity.
Reject Gate Actuation: Many systems fire a pneumatic reject arm without ever logging the trigger pulse. Capturing this signal is the first step in correlating a failure to a specific machine state.
Bridging these legacy controllers to a modern data pipeline does not require a total machine overhaul. Through systems engineering expertise, we implement communication bridges that ingest data from native protocols like EtherNet/IP or Profinet and translate it into cloud-ready formats like MQTT or OPC UA. This approach, combined with strategic technical procurement, ensures you are building an Industrial IoT data architecture that treats your existing hardware as a high-fidelity source of truth. By tapping into these internal signals, you move away from manual logs and toward a system where the machine explains its own failures.
Step 2: Contextualizing Production Data for Root Cause Analysis
Raw PLC data, while high in fidelity, is practically useless in a vacuum. A spike in motor current or a cycle time deviation tells you that a failure occurred, but it fails to explain the specific variable that caused it. To truly understand how to reduce manufacturing scrap, you must implement OT Contextualization. This is the process of wrapping raw sensor telemetry in operational metadata, such as shift schedules, operator IDs, batch numbers, and raw material lot codes.
Without this metadata layer, your Industrial IoT data architecture remains a stream of disconnected numbers. By aligning a scrap event with a specific operator ID or a job changeover timestamp, you can determine if a quality spike is a mechanical issue, like tool wear, or a process issue, such as a training gap during a complex setup. For instance, if torque limits are exceeded across all shifts regardless of who is on the floor, the problem is likely a failing bearing or a dull bit. However, if scrap rates climb only during a specific crew's rotation, you have identified a human-in-the-loop variance that no machine sensor could detect on its own.
This level of detail is critical for Parsippany-based firms that operate within complex global supply chains. Localized data architecture allows regional plants to meet enterprise reporting standards while maintaining the granular visibility needed for immediate onsite troubleshooting. As we explore in our insight on why Connected is Not AI-Ready, the goal is to create a digital twin of the event, not just the machine. By applying systems engineering expertise to unify these disparate data sources, you move from guessing why a part failed to having a definitive, multi-dimensional audit trail for every rejected unit.
Step 3: Detecting Process Drift Before Defects Occur

Once you have contextualized your data, the focus shifts from post-mortem analysis to identifying process drift. Process drift is the subtle, gradual movement of a production variable away from its optimal state. While an individual part might still pass quality checks, the underlying machine telemetry signals an impending failure. By monitoring these trends, you move from reactive scrap management to a proactive stance that stops waste at the source.
For example, consider a servo motor driving a high-speed assembly arm. A sudden spike in current is a failure, but a steady, 5% increase in current draw over a four-hour window suggests friction from a degrading bearing or a lubrication issue. In traditional setups, this machine runs until the part is visibly defective. Through systems engineering expertise, we design systems that flag these deviations in real time. Historical PLC data allows us to map these signatures against known scrap events, turning raw logs into predictive indicators.
Signal | Steady State | Drift Indicator | Potential Result |
|---|---|---|---|
Motor Current | Consistent Amperage | Gradual 3-7% increase | Bearing wear or mechanical bind |
Hydraulic Pressure | Constant PSI | Minor oscillations | Valve seal degradation |
Cycle Time | Standard Milliseconds | Incremental micro-stalls | Sensor misalignment or debris build-up |
The effectiveness of this approach is supported by industry benchmarks. In cases like the Lasso study, manufacturers reduced scrap by 20% simply by identifying these wear patterns before they crossed the reject threshold. For operations in the Northeast, where material costs are volatile, catching drift three hours early can save thousands in wasted raw stock.
This methodology is the core of a resilient Industrial IoT data architecture. These identified patterns of drift and failure are not just troubleshooting tools; they are the high-fidelity training data for future machine learning models. You cannot jump directly to "AI" without first establishing this historical baseline. By capturing the lead-up to a scrap event, you provide the AI infrastructure architecture with the labeled datasets required to eventually automate corrective actions. Detecting drift is the final bridge between standard automation and an AI-enhanced operation that anticipates how to reduce manufacturing scrap before the defect occurs.
Bridging the Gap: Moving from Excel Templates to Real Time Dashboards

Searching for a first pass yield excel template is a common starting point for operations managers, but manual spreadsheets are fundamentally retrospective. When a technician spends their Friday afternoon logging scrap counts into a cell, they are documenting history rather than managing a process. Excel serves as a lagging indicator; it tells you what you lost last week, not what you are losing right now. In a high cost environment like the Northeast, waiting for a weekly report to identify a calibration drift means five days of avoidable waste have already been paid for.
True visibility requires moving toward real time IIoT dashboards built on a unified data layer. By applying systems engineering expertise, we connect the factory floor directly to the management office. This transition allows engineers to observe scrap spikes the moment they occur. Instead of waiting for a month end report to realize a tool has been out of alignment, a live dashboard flags the deviation in minutes. This immediate feedback loop is the most effective way to learn how to reduce manufacturing scrap because it enables intervention before the shift ends. Implementing a robust Industrial IoT data architecture ensures that your data is a live diagnostic tool, not just a static record of financial loss.
Practical Scrap Management for New Jersey Industrial Operations
Industrial operations in the Parsippany-Troy Hills corridor face unique pressures, including high utility rates and competitive labor markets. Lebron Industrial Operations & AI helps local firms navigate these challenges by modernizing legacy hardware without the cost of total replacement. Through specialized systems engineering expertise, we transform existing machine signals into high-fidelity streams suitable for an Industrial IoT data architecture.
Solving how to reduce manufacturing scrap is the fastest route to achieving ROI on digital transformation because it recovers lost material costs and unlocks hidden capacity immediately. By converting your shop floor into an AI-ready environment, we ensure your facility remains competitive in the demanding Northeast manufacturing landscape. Our approach focuses on technical procurement and data integrity, ensuring that every byte extracted from your PLCs serves the ultimate goal of operational uptime.
Reducing scrap starts with the data you already have within your PLCs. By capturing and analyzing these signals, you can pinpoint inefficiencies before they become waste. While the path to optimization is clear, implementation often requires specialized technical knowledge to ensure accuracy. If you want expert help navigating these complex data structures or deploying AI models, feel free to explore our services. We are here to help your facility reach its full potential through smarter operations.