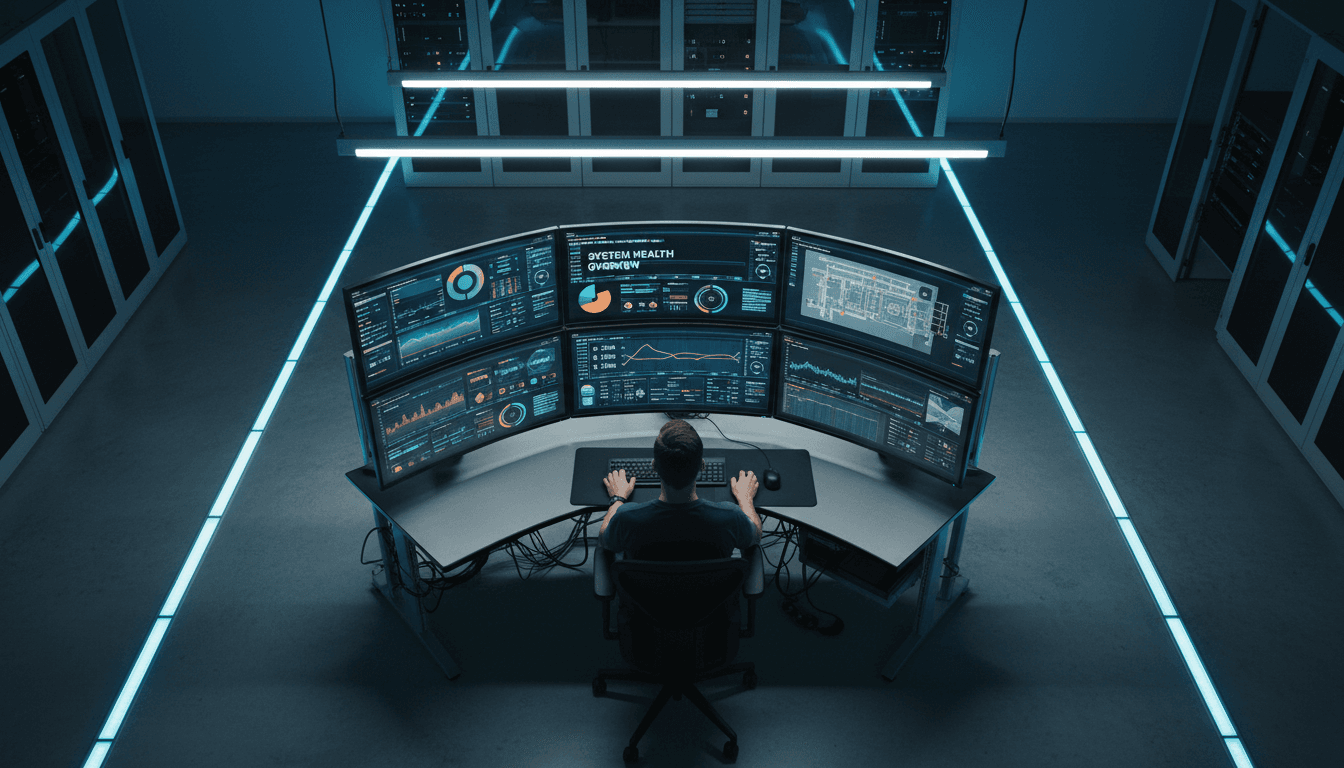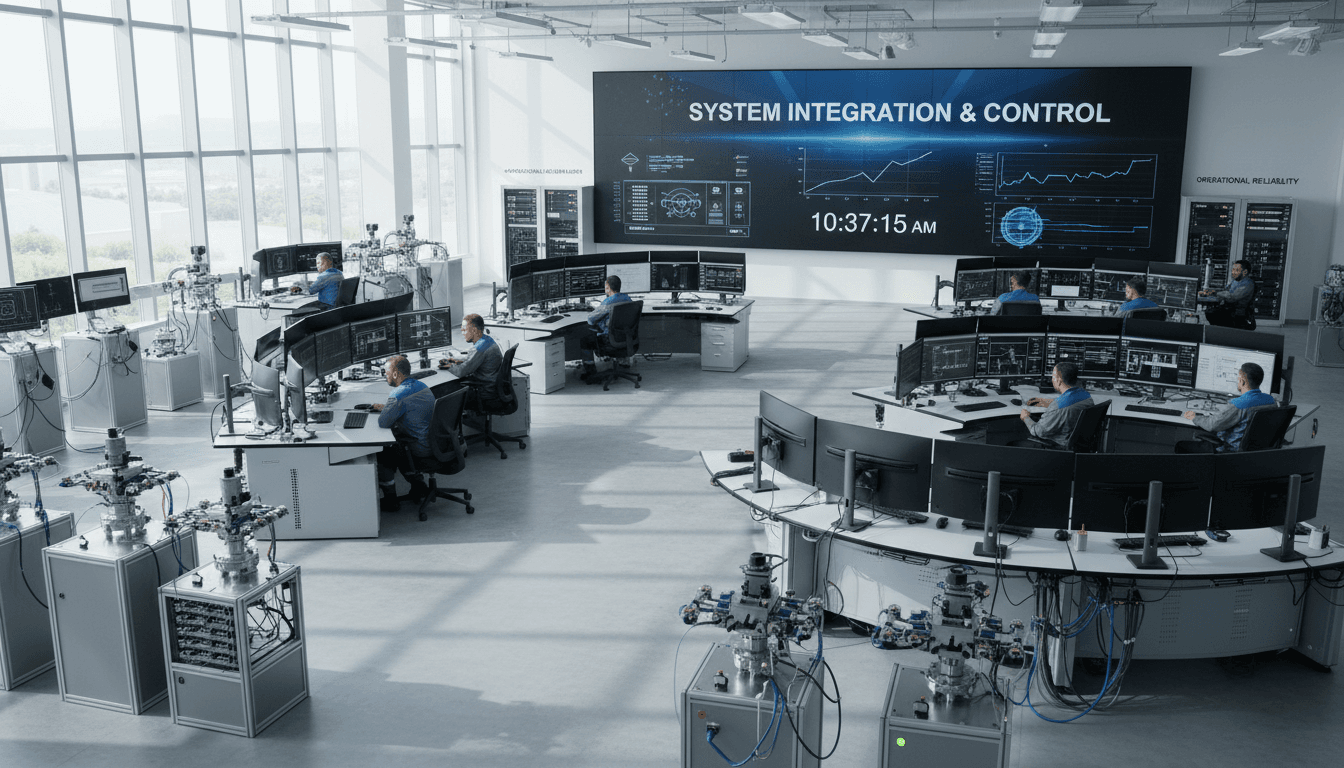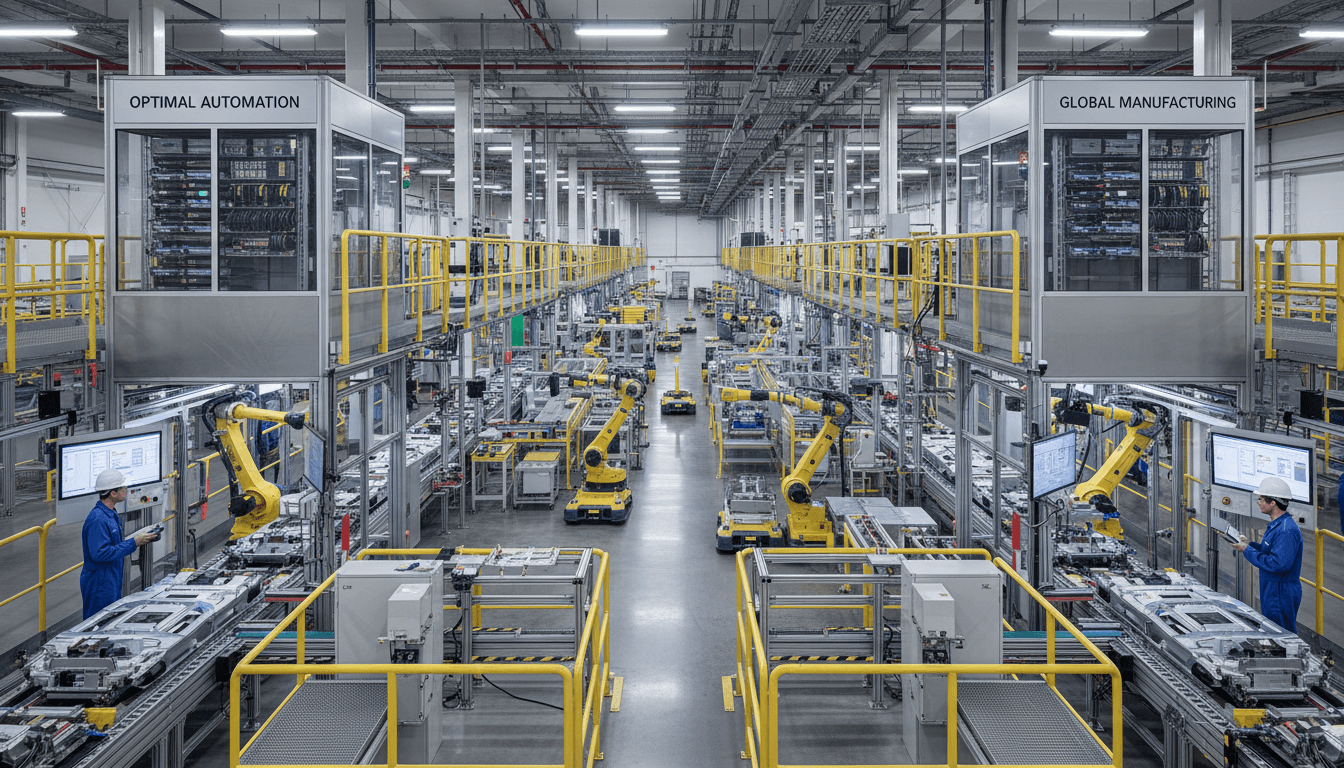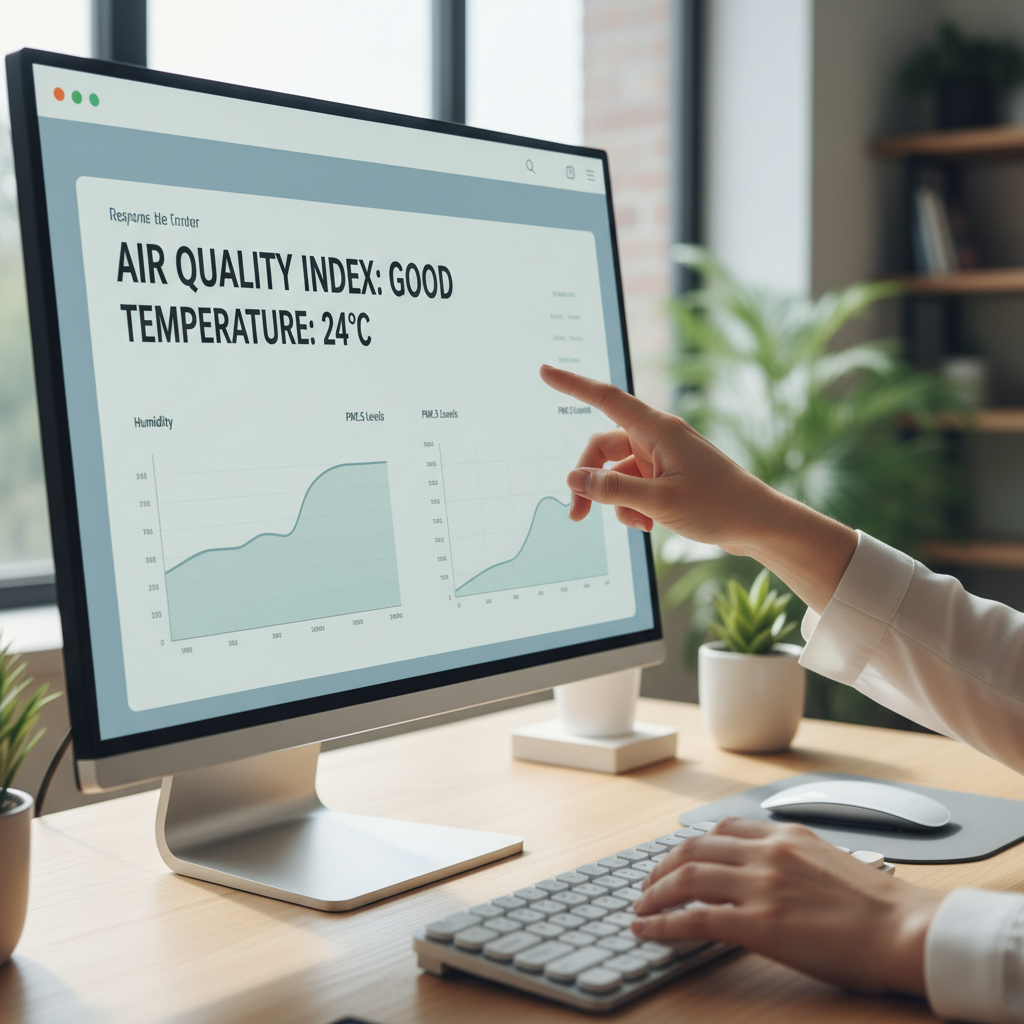
Building a production dashboard from PLC data involves connecting industrial controllers to visualization software to monitor real-time manufacturing KPIs and equipment status. This process transforms raw machine signals into actionable insights; as a result, manufacturers can reduce downtime and improve operational efficiency by utilizing information already available within their existing hardware.
Most manufacturing leaders are frustrated by the reality that their most valuable operational data remains trapped inside machine cabinets, siloed within legacy PLC logic while production teams rely on manual logs and delayed reports. This disconnect between real-time machine performance and executive visibility results in reactive decision-making that erodes margins and stifles throughput. Bridging this gap requires more than just a screen; it demands a strategic approach to extracting and contextualizing the signals your hardware is already generating. This article provides a technical roadmap for building a high-impact production dashboard. We will explore how to select high-value PLC tags, evaluate the merits of OPC UA versus MQTT connectivity, and design KPI visualizations that serve operations leaders rather than just displaying raw numbers. By the end, you will understand how to turn your existing shop floor infrastructure into a dynamic engine for continuous improvement.
The Data Goldmine Trapped in Your Existing PLC Architecture
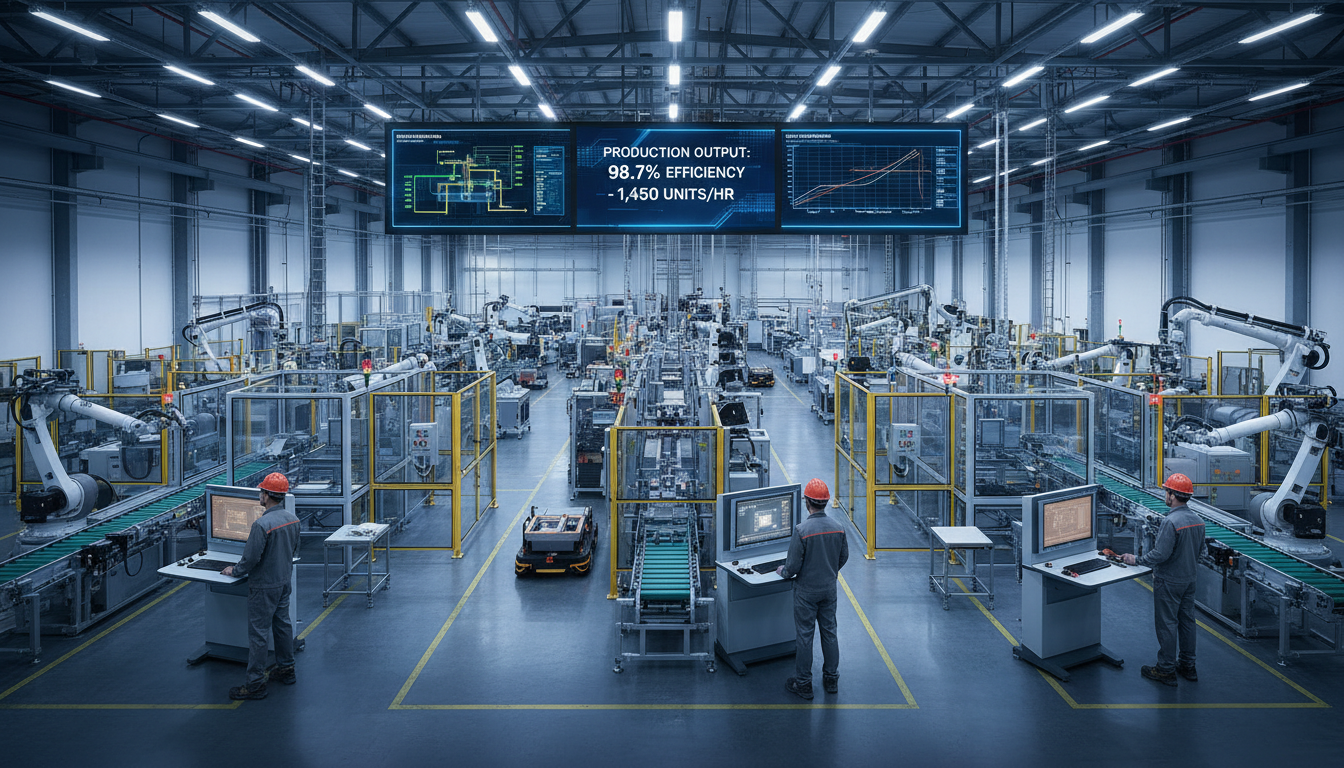
Operations leaders often walk past rows of Allen Bradley, Siemens, or Omron PLCs without realizing they are standing next to a massive, untapped data repository. Currently, these controllers are dedicated to machine logic, managing the millisecond by millisecond timing of valves, motors, and sensors. However, the exact same signals that tell a machine to cycle also contain the pulse of your business. This information remains trapped in the cabinet, utilized only for the control loop rather than for high level business intelligence.
A production dashboard from PLC data serves as the definitive bridge between the shop floor and the front office. Traditionally, managers have relied on "clipboard and Excel" methods to track performance. These manual processes are inherently flawed, suffering from human error and a reporting lag that makes the data obsolete by the time it reaches a supervisor’s desk. Instead of performing a shift autopsy at 5:00 PM, a real time data pipeline allows for proactive adjustments.
At Lebron Industrial Operations & AI, we believe you do not need a multi-million dollar "digital transformation" roadmap to gain visibility into your uptime today. By leveraging industrial IoT data architecture, we help firms extract value from the hardware they already own. Using PLC to Cloud bridges, we turn raw machine states into actionable KPIs. This approach bypasses the need for total equipment replacement, focusing instead on building a scalable infrastructure that connects legacy hardware to modern analytics. Our technical procurement services ensure you get the right gateways to make this connection secure and reliable without overhauling your entire existing footprint.
Step 1: Identifying High Value PLC Tags for Your Dashboard
The first step in extracting value is a purposeful audit of your controller’s tag database. Most PLCs contain thousands of variables, but only a small fraction are meaningful for a production dashboard from PLC data. You must distinguish between raw machine signals, such as digital inputs from a physical proximity sensor, and calculated tags or registers maintained within the PLC logic. While raw signals provide the immediate state of a component, calculated tags often provide the context needed for business intelligence.
When auditing your hardware, prioritize these three specific categories of data points:
Cycle Start/State Signals: These boolean tags indicate when the machine is actively processing a part. They are the essential foundation for calculating Takt time and overall availability.
Part Count Integers: Look for registers that accumulate total cycles or "good part" counts. These provide immediate insight into throughput and scrap rates without requiring secondary sensors.
Fault Code Registers: Rather than pulling every individual alarm bit, identify the integer register that stores the current active fault code. This allows your dashboard to categorize downtime reasons automatically.
Operations leaders should collaborate closely with their controls engineers during this phase to map these tags to the KPIs that drive profitability. Attempting to ingest every available tag leads to "data swamp" syndrome, where meaningful insights are buried under millisecond level noise that has no impact on the bottom line. By selecting only high value tags, you simplify the industrial IoT data architecture and reduce the processing load on your network.
If your existing hardware lacks the memory to store historical registers, our technical procurement services can identify the specific PLC to Cloud bridges needed to aggregate and timestamp this data at the edge. Starting with a lean, purposeful tag list ensures your dashboard remains a precision tool for decision making rather than a confusing wall of numbers. This focused approach allows you to see the true heartbeat of the shop floor without overhauling your entire logic program.
Step 2: Choosing the Right Data Bridge: OPC UA versus MQTT
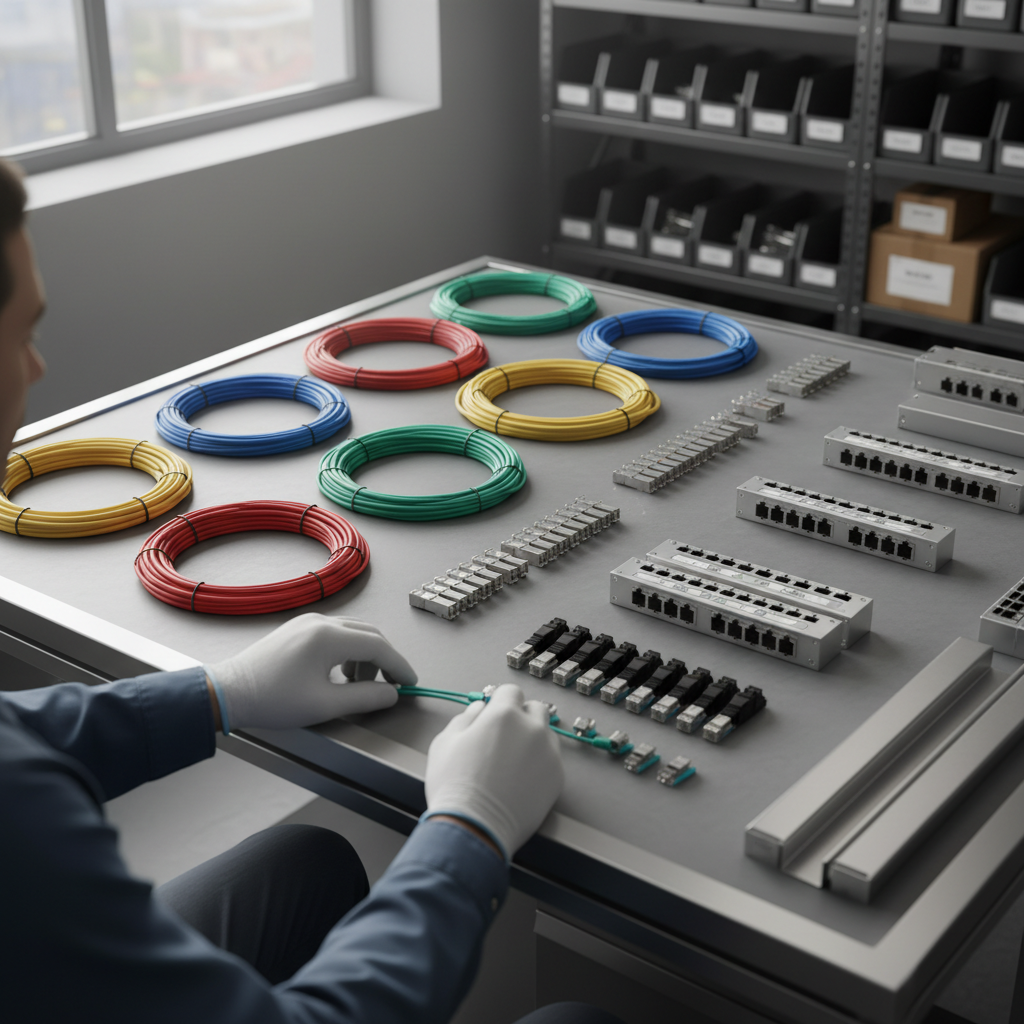
Once you have identified your high value tags, the technical challenge shifts to transporting that data across your network without compromising the stability of the control loop. A production dashboard from PLC data requires a reliable transport protocol to move information from the operational technology (OT) layer to the information technology (IT) layer. This is where the choice between OPC UA and MQTT becomes critical for your long term industrial IoT data architecture.
OPC UA is the established heavyweight of the industrial world. It uses a client/server architecture that allows for complex data modeling and deep security integration. It is exceptionally robust for local, machine to machine communication where the dashboard sits on the same local network as the PLC. However, OPC UA can be resource intensive and often requires complex firewall configurations to move data outside of the plant floor.
MQTT has emerged as the preferred protocol for modern AI workflows and cloud based analytics. Unlike the client/server model, MQTT uses a "Pub/Sub" (Publish/Subscribe) architecture. The PLC or an intermediate gateway "publishes" data to a central broker, and any authorized application can "subscribe" to that data stream. This creates a lightweight, decoupled system that is ideal for remote monitoring and high scale deployments.
Feature | OPC UA | MQTT |
|---|---|---|
Architecture | Client/Server | Publish/Subscribe (Broker) |
Network Load | Higher (Heavy Headers) | Minimal (Lightweight) |
Cloud Readiness | Requires Gateways | Native Cloud Compatibility |
Best Use Case | Local SCADA & M2M | Cloud Dashboards & AI Pipelines |
Bridging these two worlds is a core competency of Lebron Industrial Operations & AI. We design and deploy PLC to Cloud bridges that act as the physical and logical link between legacy hardware and modern software. By utilizing an IIoT gateway, we can poll your Siemens or Allen Bradley tags via OPC UA locally and then translate that data into MQTT for secure, efficient transmission to your dashboard. This hybrid approach, supported by our technical procurement services, ensures that your data remains structured and secure while being accessible from any corporate terminal in our Parsippany-Troy Hills backyard or at a remote facility across the globe.
Step 3: Beyond the Andon Board: Visualizing KPIs for Operations Leaders
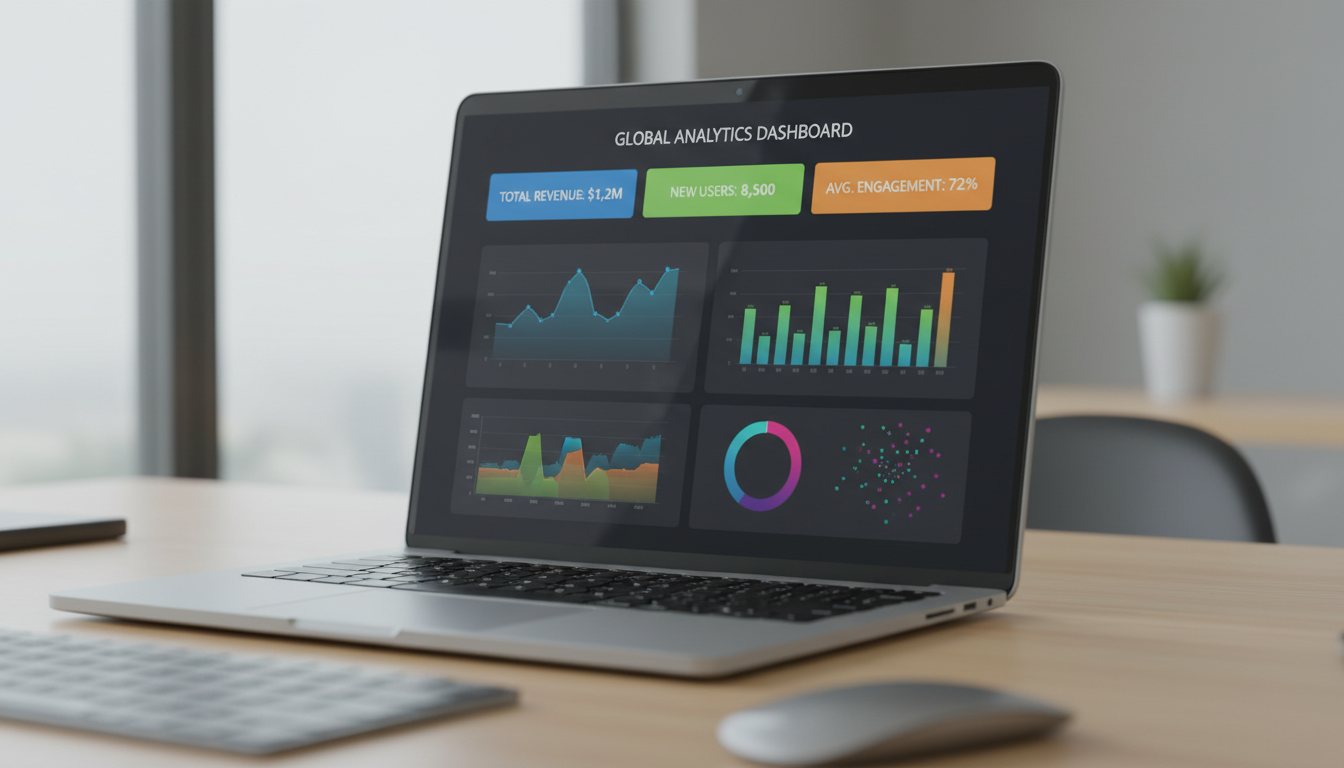
A strategic production dashboard from PLC data goes beyond the reactive signaling of a traditional Andon board. While red, yellow, and green status lights are essential for immediate shop floor awareness, they do not provide the longitudinal insights required for operational excellence. Effective visualization transforms raw integers into high level KPIs that drive capital expenditure and labor decisions.
To gain a competitive edge, focus on three primary metrics. First, Overall Equipment Effectiveness (OEE) provides a comprehensive view of Availability, Performance, and Quality in a single ratio. Second, Mean Time to Repair (MTTR) identifies bottlenecks in maintenance responsiveness and part availability. Finally, tracking Real time Cycle Time versus Target ensures production stays on schedule before a shift falls behind. Instead of relying on static numerical values, utilize time series graphs. These visualizations expose trends, such as performance degradation over the course of a long shift or during specific environmental changes, that a single percentage point would obscure.
The power of a robust industrial IoT data architecture lies in its geographical reach. When your PLC to Cloud bridges are correctly configured, an operations leader in our Parsippany-Troy Hills headquarters can monitor the granular performance of a production line across the country in real time. This centralized visibility is made possible through technical procurement services that select the right visualization layers to match the underlying data structure. By moving past simple status alerts, you transition from reactive fire fighting to strategic oversight, ensuring that every cycle count contributes to a broader understanding of global industrial performance and uptime analytics.
The Build versus Buy Dilemma for Industrial Dashboards
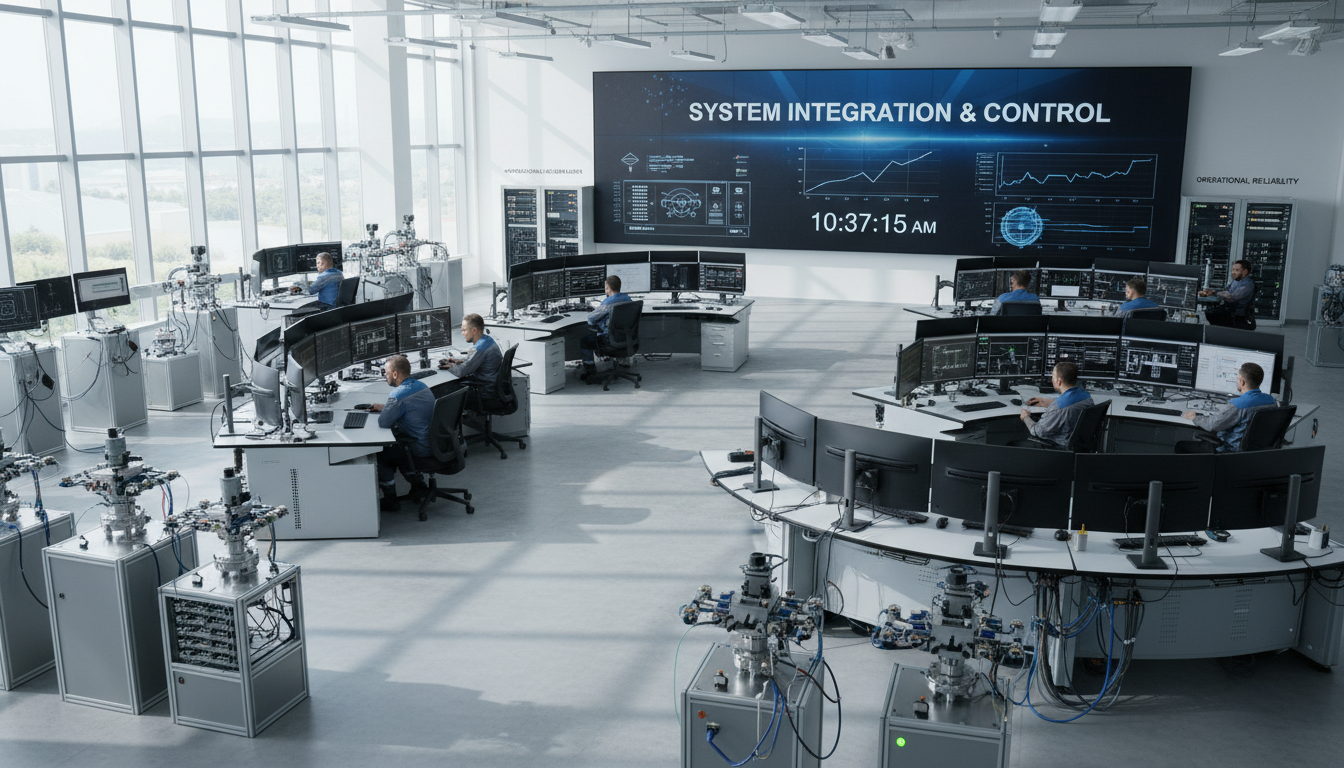
Navigating the implementation of a production dashboard from PLC data often leads to the build versus buy crossroads. Many facilities begin with Excel based tools, but these inevitably fail at scale because they lack automated, real time connectivity to the sensor level. When moving beyond spreadsheets, you must weigh the speed of off the shelf SaaS platforms against the long term flexibility of custom builds using tools like Grafana, Ignition, or Power BI.
Off the shelf platforms offer rapid deployment but often carry a high total cost of ownership (TCO) due to per tag or per user licensing fees that scale poorly. Conversely, a custom build provides granular control over your operational logic and avoids vendor lock in. However, the success of either path depends entirely on the underlying industrial IoT data architecture. At Lebron Industrial Operations & AI, we recommend a modular approach that separates the data layer from the visual layer.
Strategy | Pros | Cons |
|---|---|---|
Off the Shelf SaaS | Faster initial setup; Managed infrastructure | Higher recurring costs; Limited customization |
Custom (Ignition/Grafana/Power BI) | No per tag fees; Complete data ownership | Requires dev expertise; Higher initial effort |
Focus your initial investment on the data pipeline, the most difficult aspect of the project, by deploying robust PLC to Cloud bridges. By prioritizing a clean, structured data flow first, the visualization layer becomes a modular component. This allows you to swap your dashboard interface as business needs evolve without re-engineering the entire machine level connection. Our technical procurement services assist in selecting the software stack that balances immediate visibility with long term scalability.
Ensuring Data Integrity and Shop Floor Security
Security often stands as the primary hurdle when deploying a production dashboard from PLC data. IT departments rightly prioritize network isolation to prevent cyber threats from reaching the shop floor. To maintain system stability, your industrial IoT data architecture must ensure that data extraction never adds latency to the PLC’s primary control loop.
We recommend establishing a Demilitarized Zone (DMZ) between the plant floor and the enterprise network. Within this layer, we utilize PLC to Cloud bridges and secure gateways that facilitate one-way data flow, allowing outbound telemetry while blocking unauthorized incoming traffic. This unidirectional approach protects critical infrastructure while providing the visibility managers need. Through our technical procurement services, we source hardware that satisfies strict IT security protocols without compromising real-time performance analytics. This architecture ensures that shop floor operations remain isolated and resilient, even as data moves into the cloud.